🍛 Rohan's Rasoi – Restaurant & Sales Analytics
SQL-Based Restaurant Analytics Project
The Rohan's Rasoi project focuses on restaurant operations, menu performance, and customer preferences using SQL analytics. Advanced queries, joins, and aggregation functions help identify best-selling dishes, customer order patterns, and peak dining hours. These insights assist management in menu optimization, staffing decisions, and revenue maximization.
Project Highlights
About the Project
Overview
The Rohan's Rasoi project provides insights into restaurant operations and customer dining patterns. By integrating orders, menu items, and customer data, SQL analytics uncover trends in dish popularity, revenue, and customer behavior. This helps management make informed decisions about menu offerings, staffing, and marketing strategies.
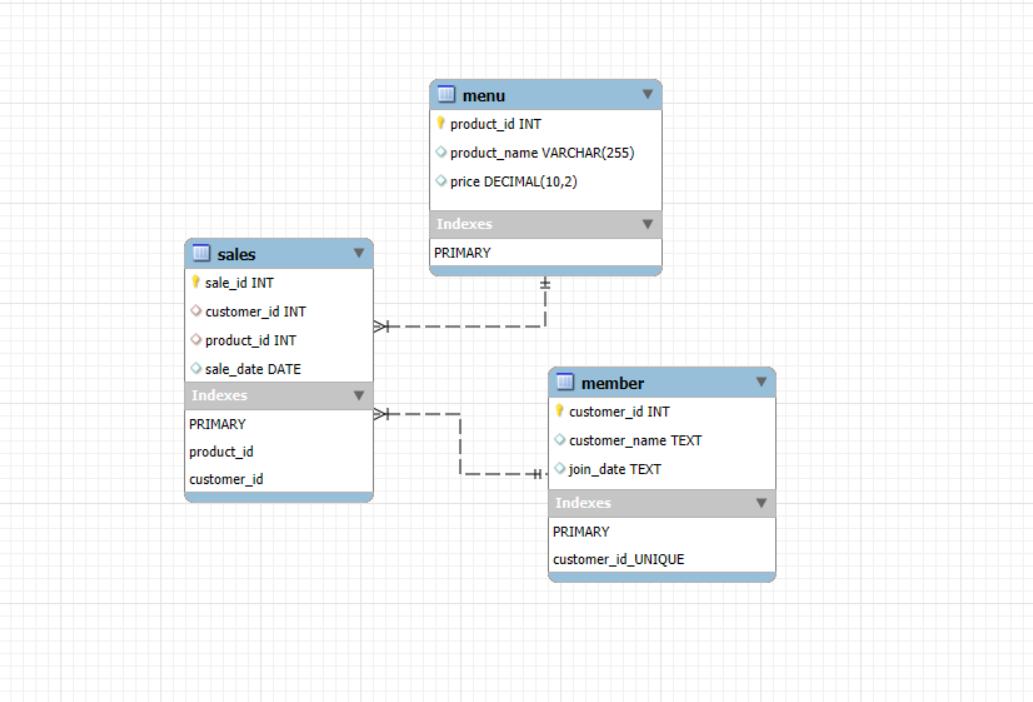
SQL Process & Data Modeling
- 📥 Extract: Combined orders, menu items, and customer tables for analysis.
- 🧹 Transform: Standardized menu names, handled missing orders, and cleaned timestamps.
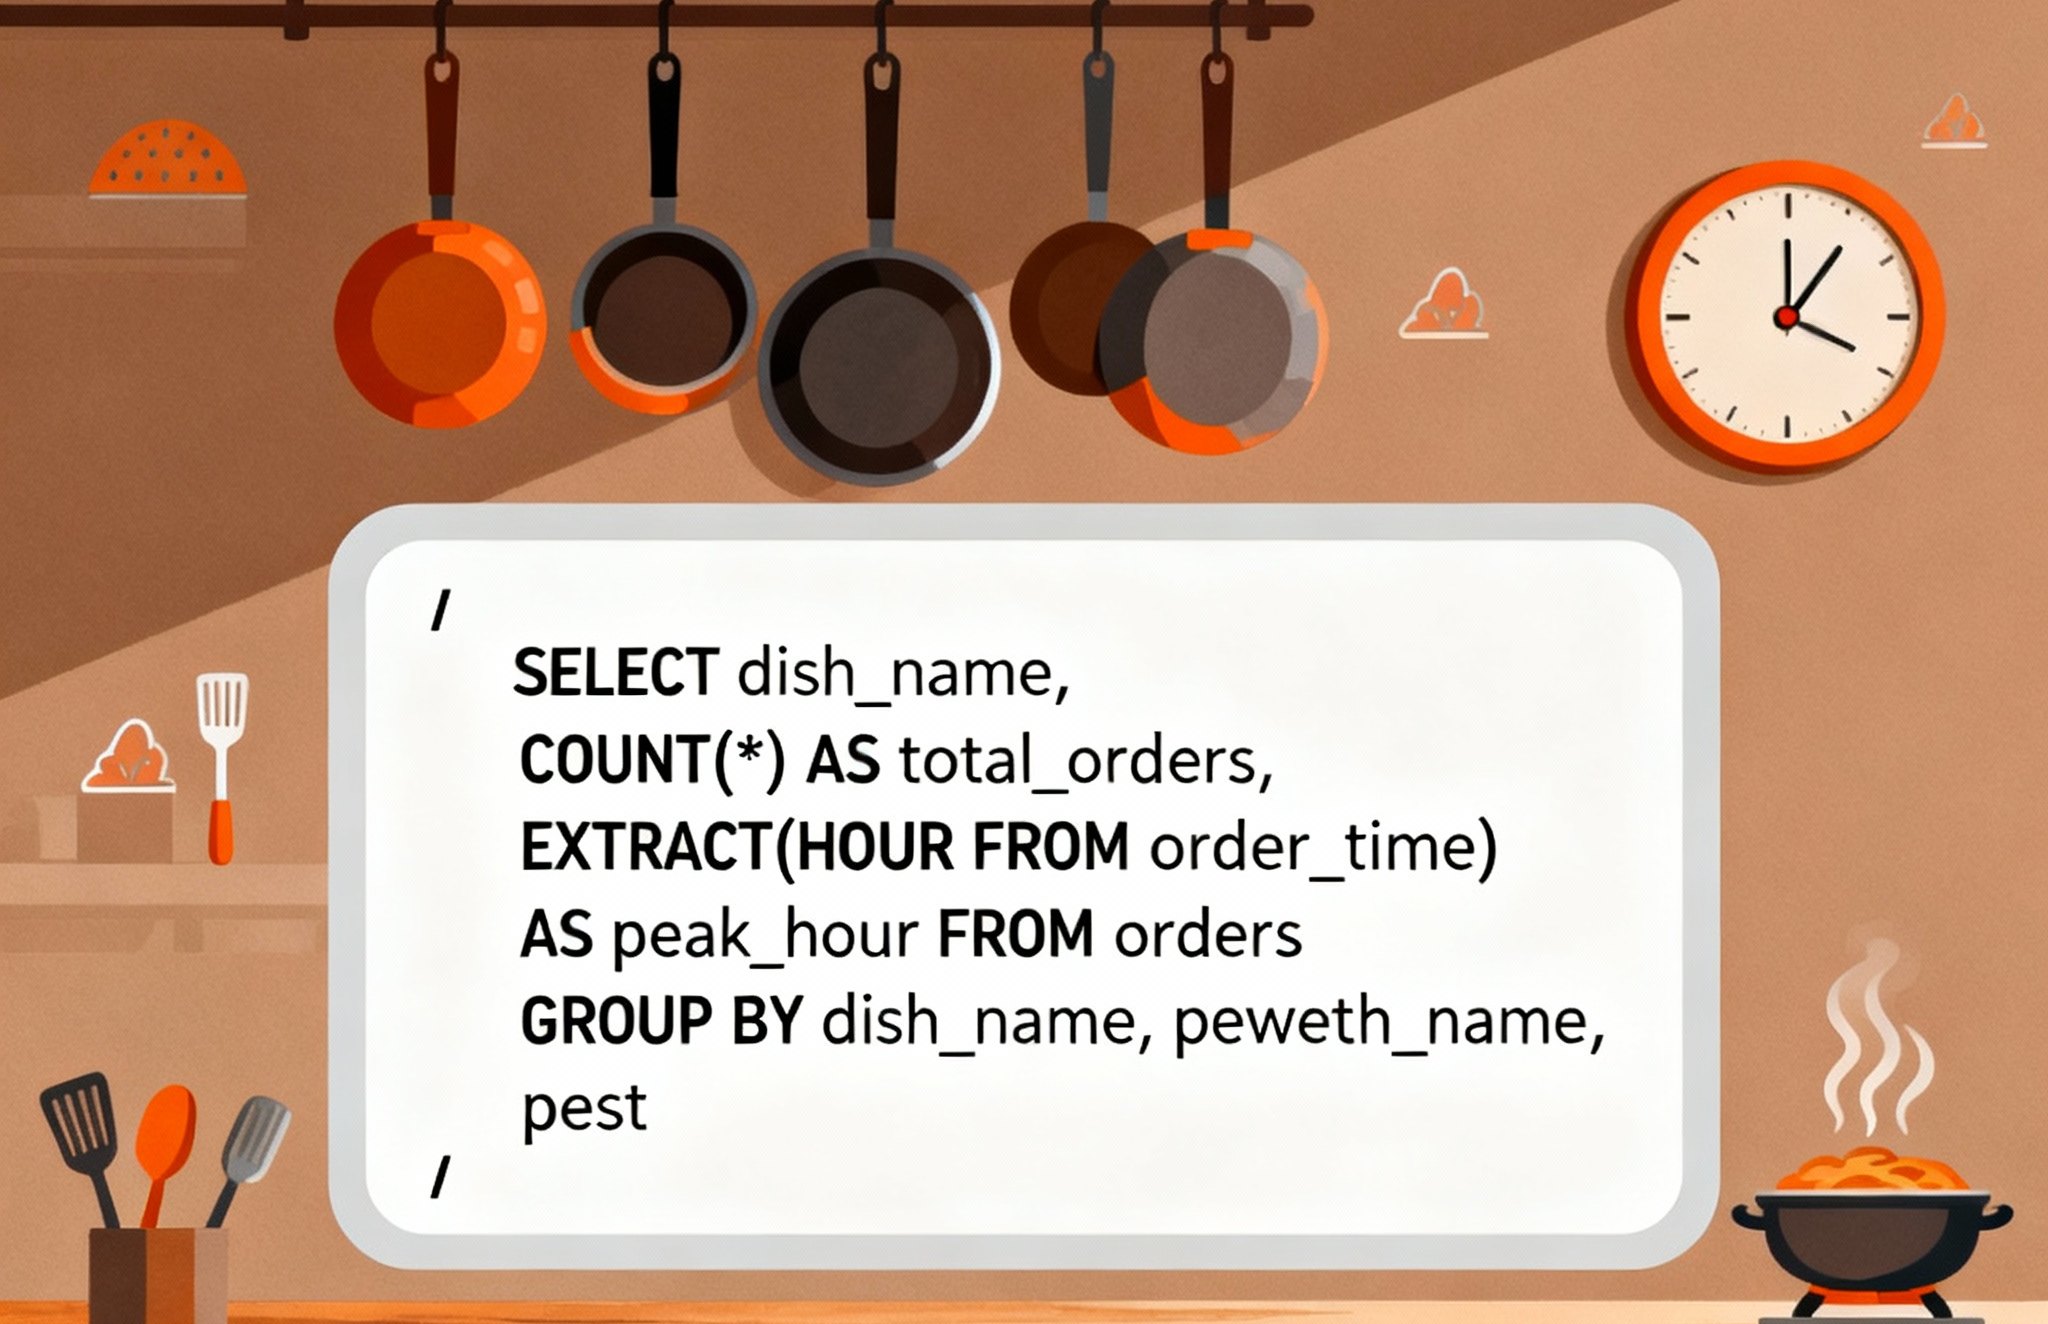
- 🔍 Analyze: Applied SQL aggregation, ranking, and partitioning for insights on sales and peak hours.
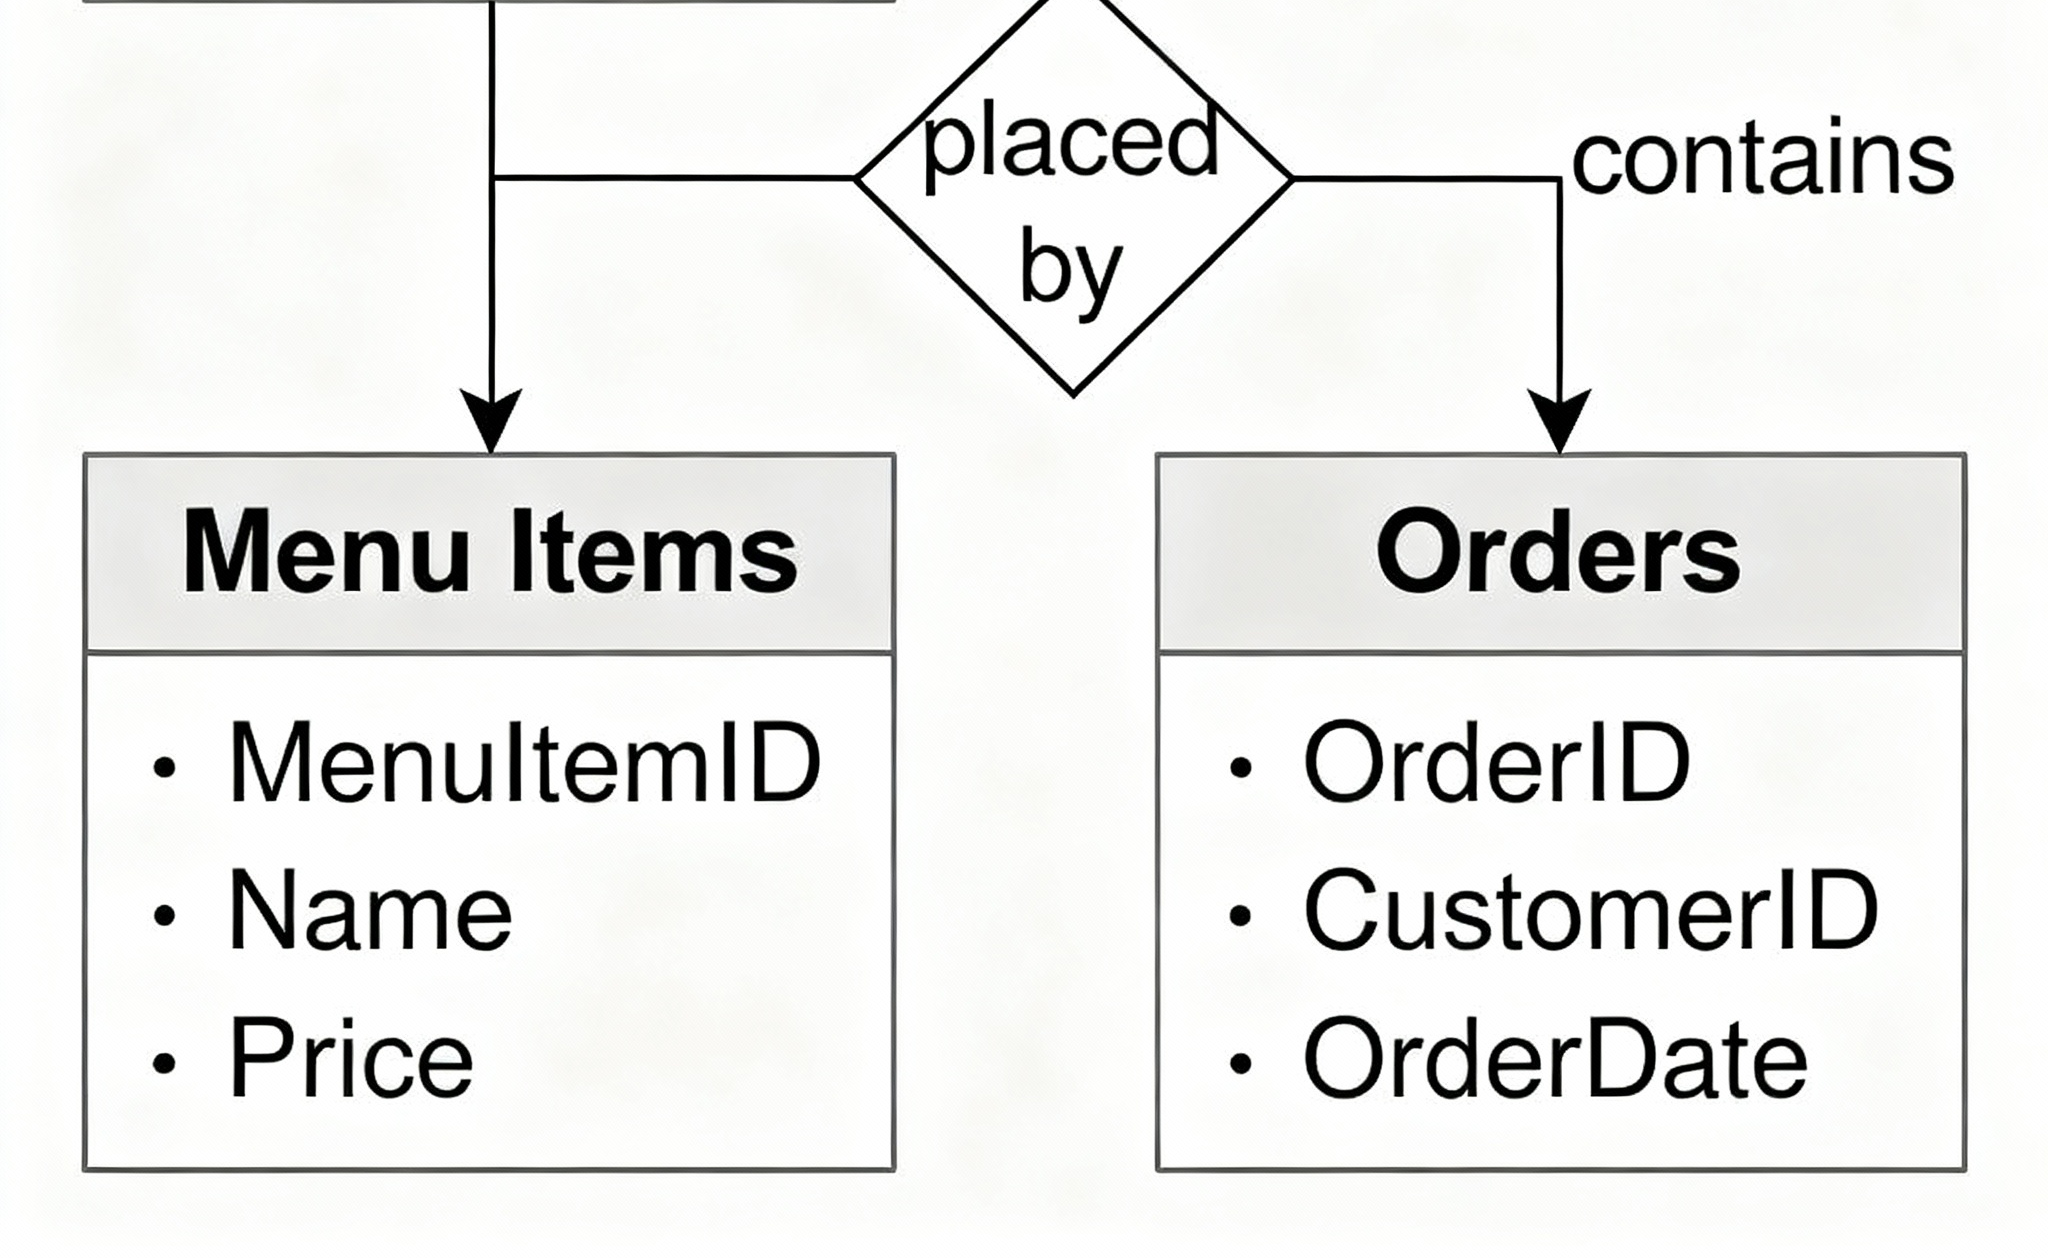
- 📊 Model: Built a data mart linking orders, menu items, and customers for efficient analytics.
Key Insights
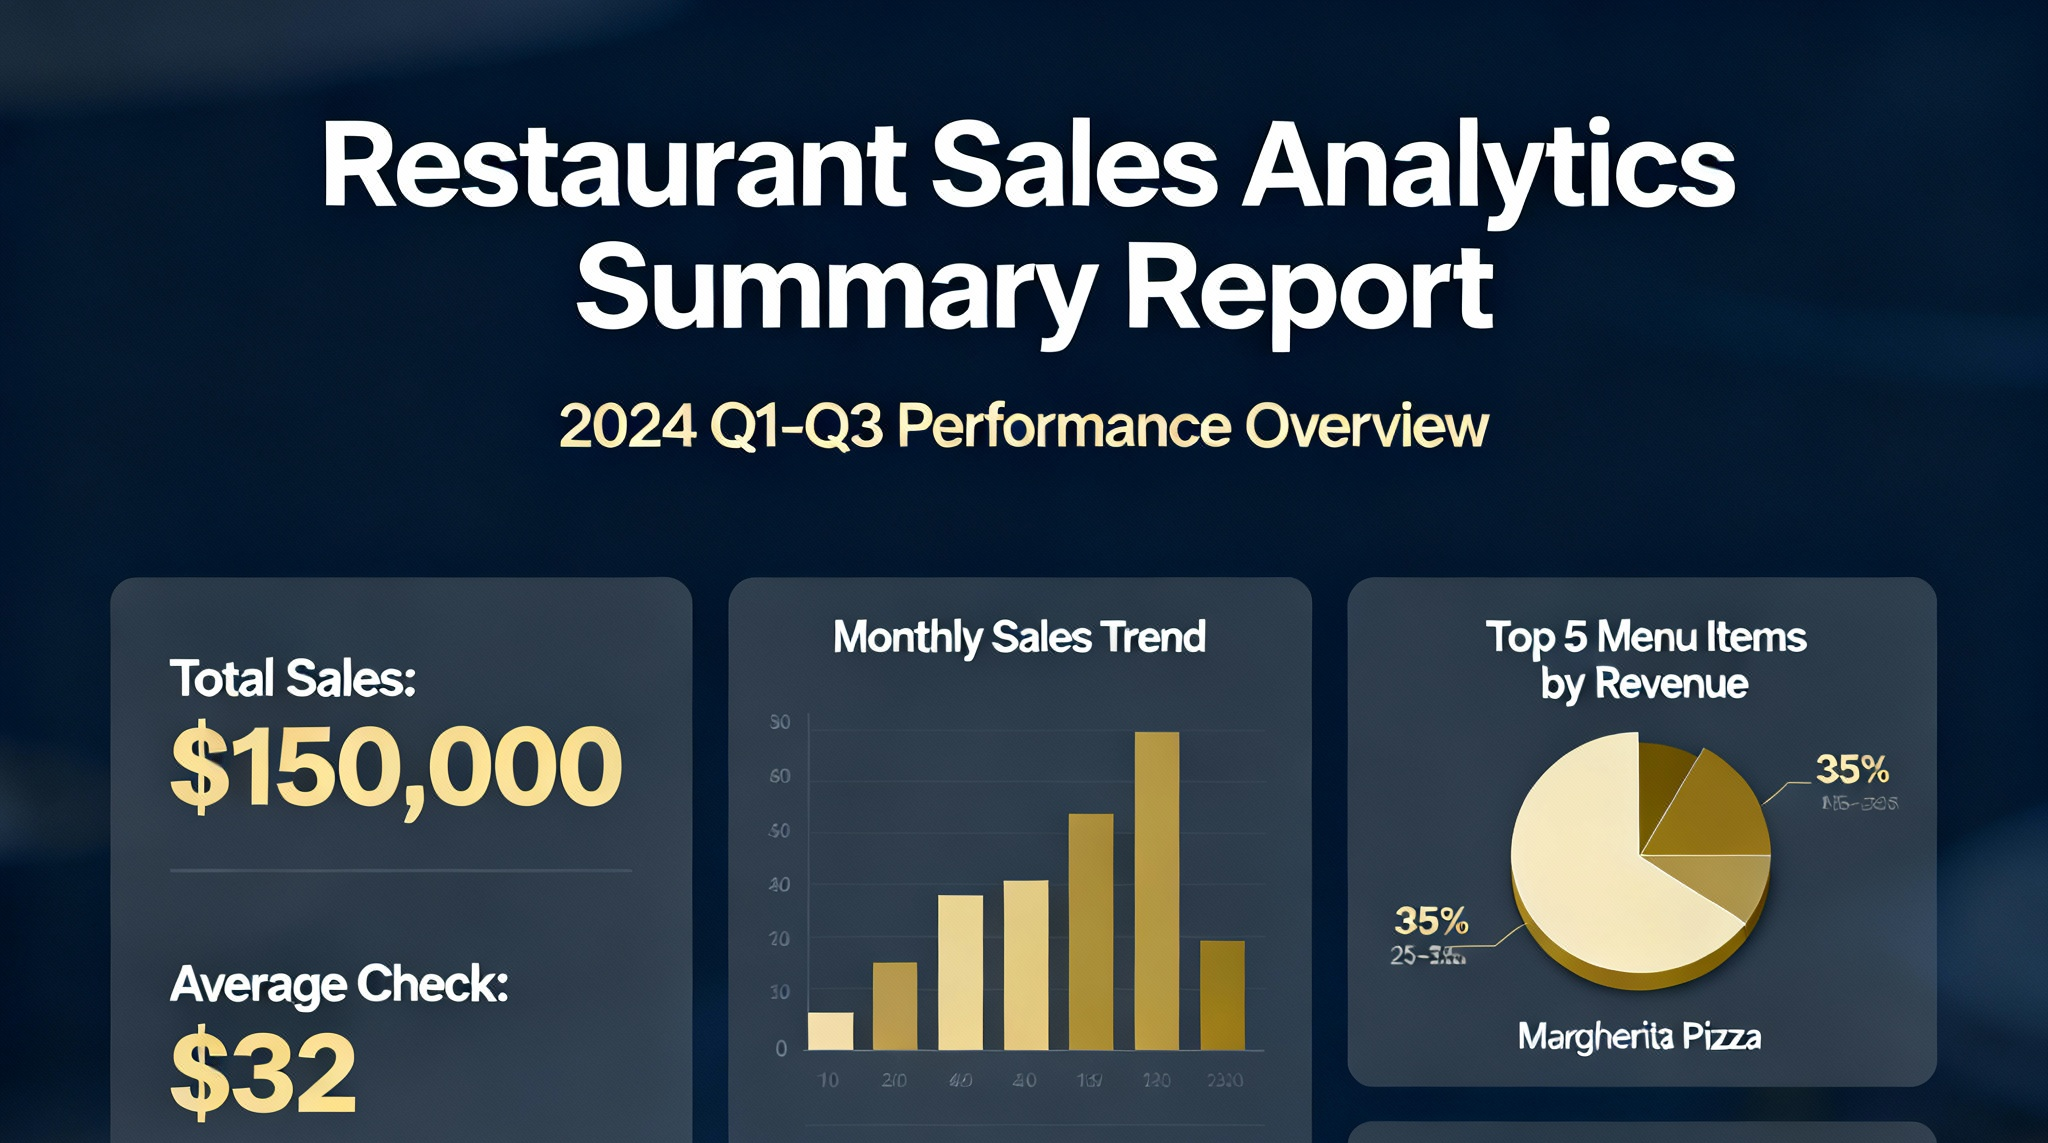
- 🍛 Top 10 dishes contributed to 65% of total revenue.
- 📈 Peak dining hours were 12 PM – 2 PM and 7 PM – 9 PM, suggesting optimal staffing schedules.
- 👥 Repeat customers spent 25% more on average than new customers.
- 🌍 Regional order analysis helped optimize delivery zones and marketing campaigns.
When:
2025
Mode:
SQL Data Analysis
Dataset:
Orders, Menu Items & Customer Data
Focus:
Restaurant Operations & Customer Analytics
Project Snapshots
Business Impact
📊 Optimized menu offerings and increased revenue through dish popularity analysis.
💬 Improved staffing and service efficiency during peak hours using SQL insights.
🚀 Enhanced customer retention by identifying repeat customer patterns and preferences.
Challenges & Learnings
⚙️ Handling multiple data tables and cleaning timestamp and order data efficiently.
🧩 Creating accurate segmentation and revenue insights from transactional data.
💡 Strengthened skills in SQL, restaurant analytics, and operational optimization.